Charts (also called graphs) are used to relay data or information to a user in an easy-to-understand graphic. They are often found in analytics or financial services dashboards.
Applies to:
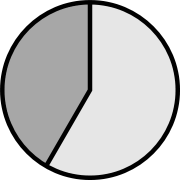
Pie chart
Pie charts are a circle graphic used to represent a statistical proportion. Each slice of the pie chart is used to represent a proportion of a population.
On a user interface dashboard, pie charts are usually used to compare different groups.
Use a pie chart when:
- You want to show a ratio.
- There is no overlap between the different categories.
- You want to show a ratio at a particular point in time, not how the variables change over time.

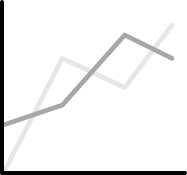
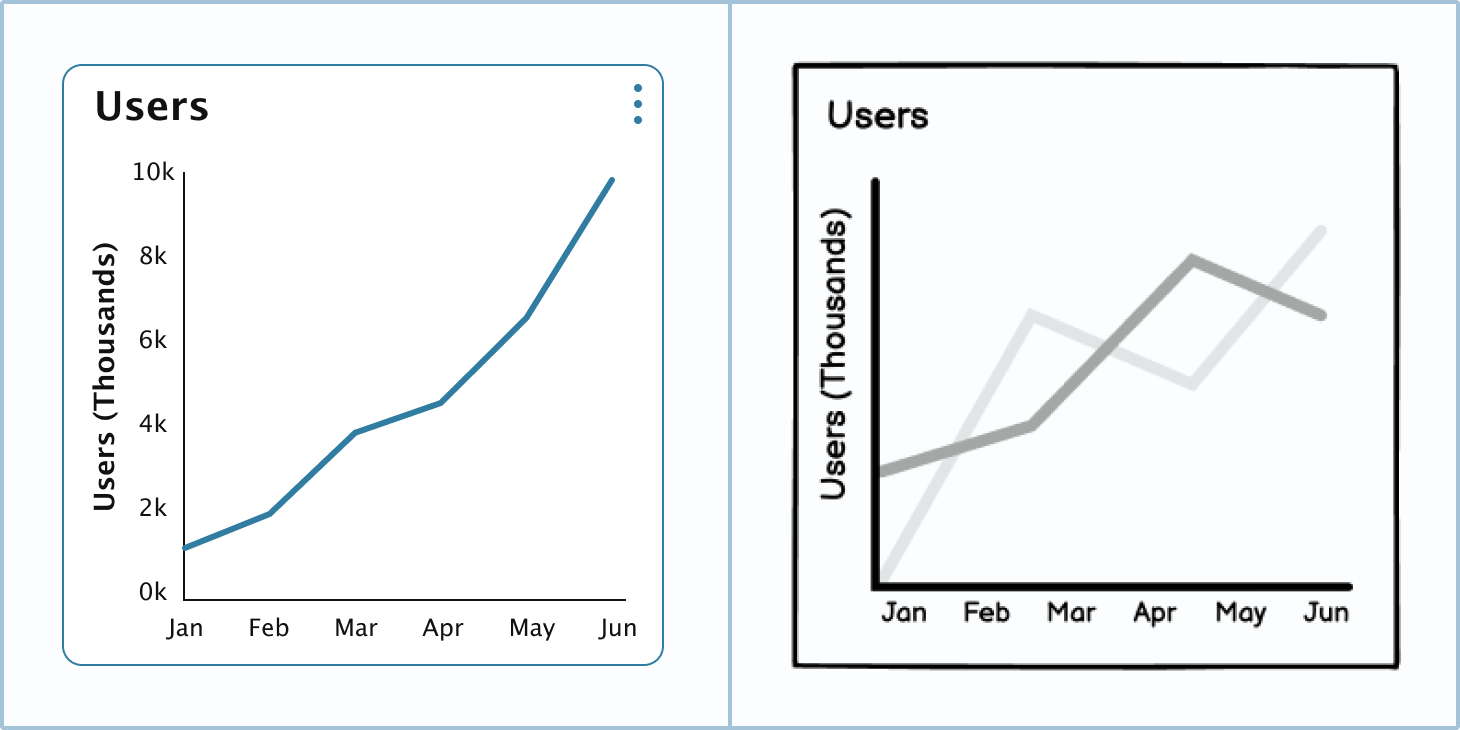
Line chart
A line chart is used to measure the growth or decline of a specific variable over time. Line charts are often used in financial services or investment platforms to show users how much their investments have grown over time.
Use a line chart when:
- You want to show change over time.
- You want to show cumulative growth over time.
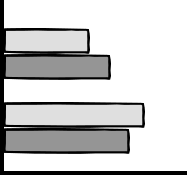
Bar chart
A bar chart is used to show the proportional size of a category. Unlike a pie chart, the focus is on actual numbers and not a ratio.
Use a bar chart when:
- You want to show exact numbers and not a ratio.If you have a lot of items or categories on the y-axis.
- You want to compare categories at a particular point in time, not how they change over time.

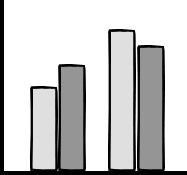
Column chart
A column chart is similar to a line chart in that it shows growth over time. Unlike line charts, column charts tend to use the value per month and not accumulate the values over time.
Use a column chart when:
- You want to show growth over time.
- You want to show non-cumulative data.
- You want to compare the growth of five or fewer categories.

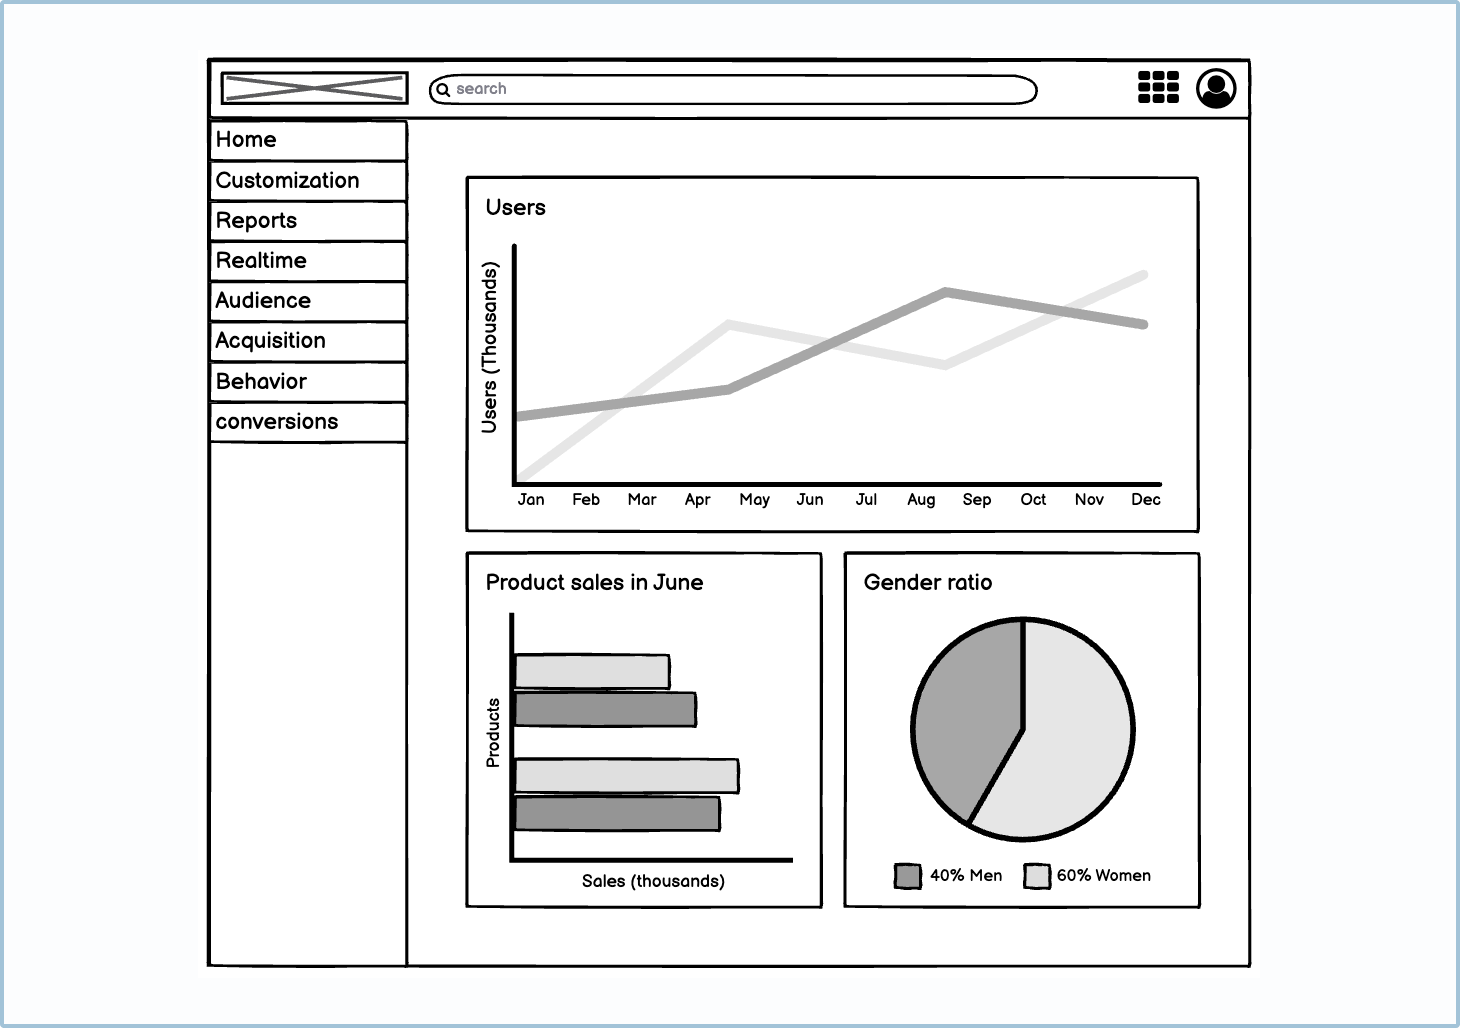
Dashboards
Dashboards are an interface type usually used by marketers and statisticians. The power of a dashboard is in how informative its graphs are and the data they can provide. The data from these graphs can determine the product’s future, so it’s vital to get them right.
When building a dashboard, make sure to highlight the most valuable metrics.