Wireframes
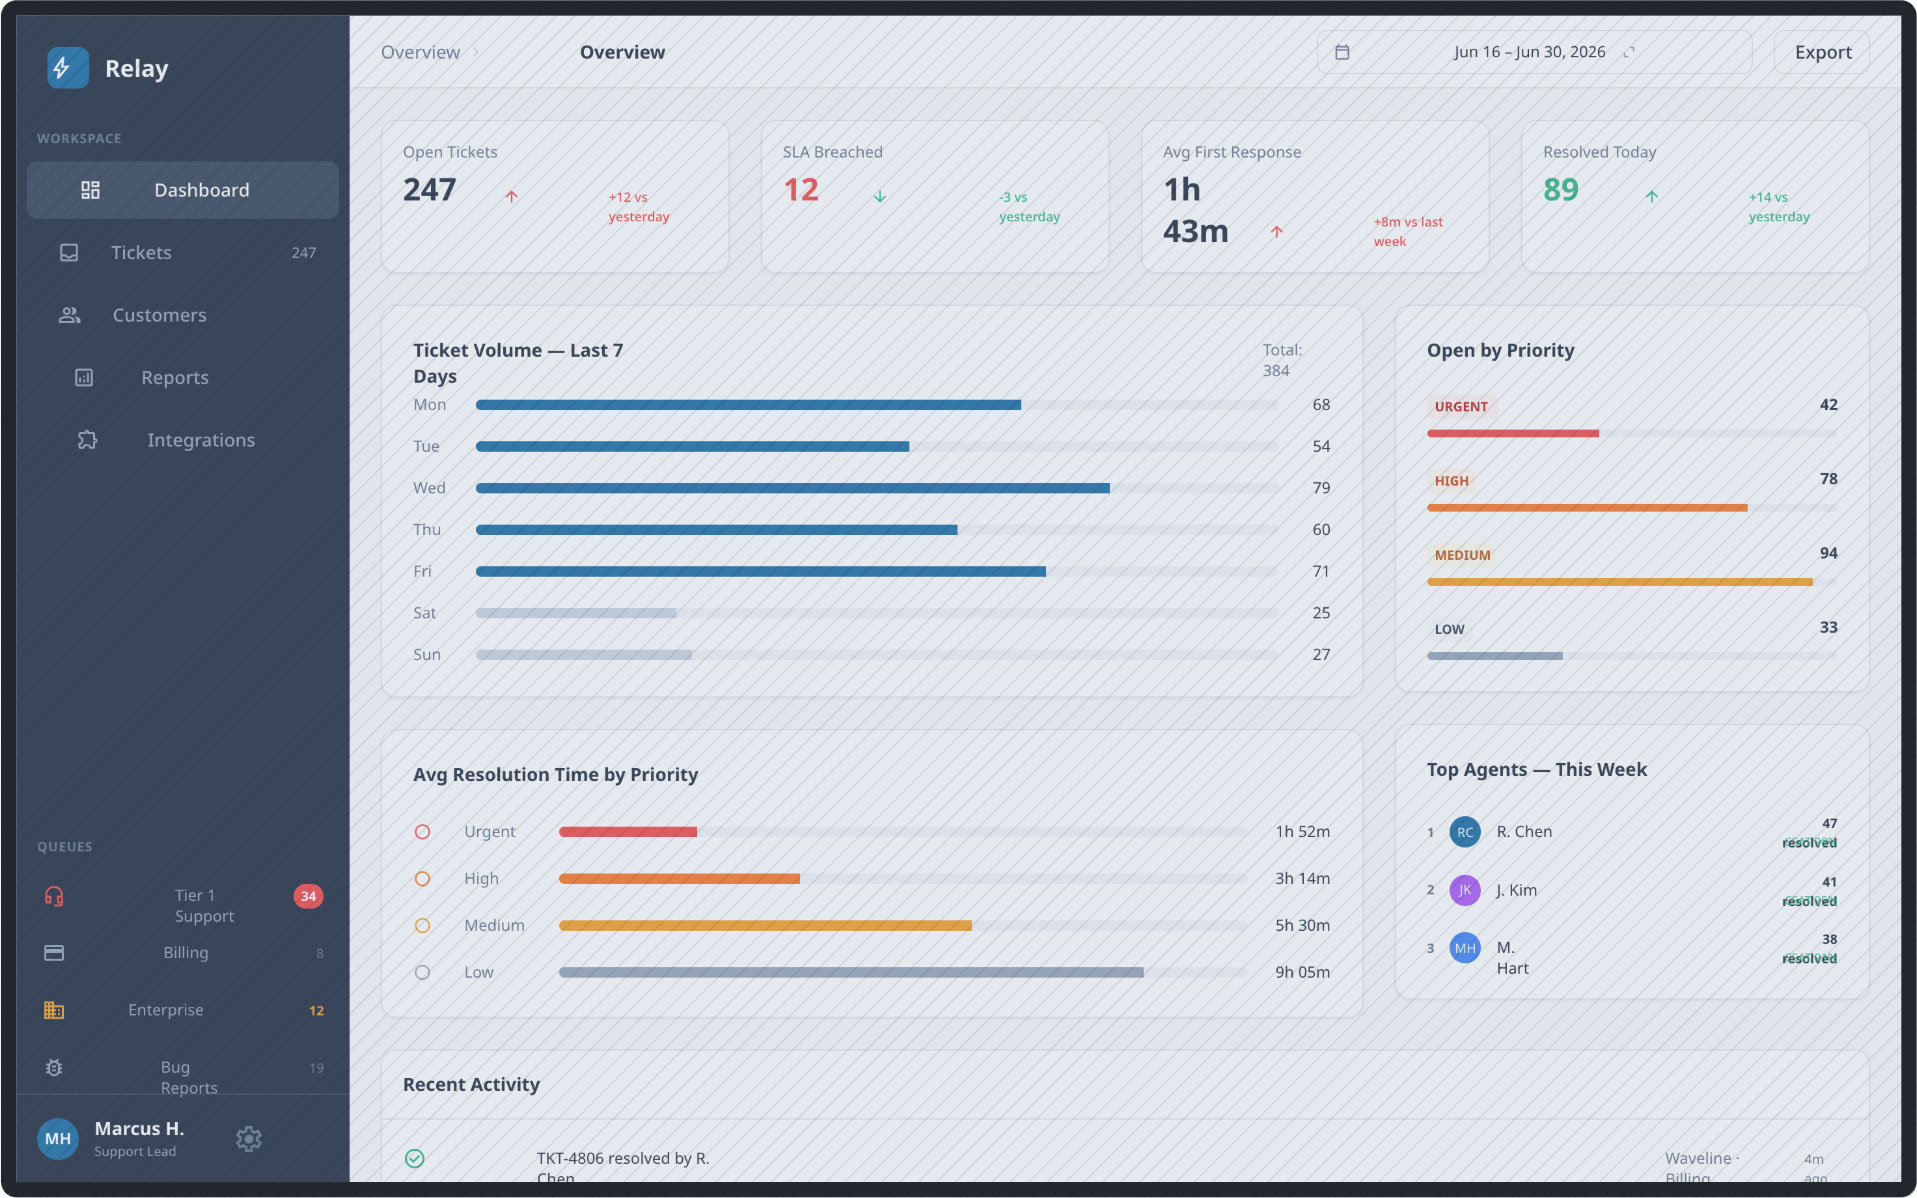
Five screens map out the core views of the tool: a high-level metrics overview with KPIs and queue summaries, a ticket queue with a split-pane reading view, a customer directory, a reporting and analytics view, and an integrations manager.
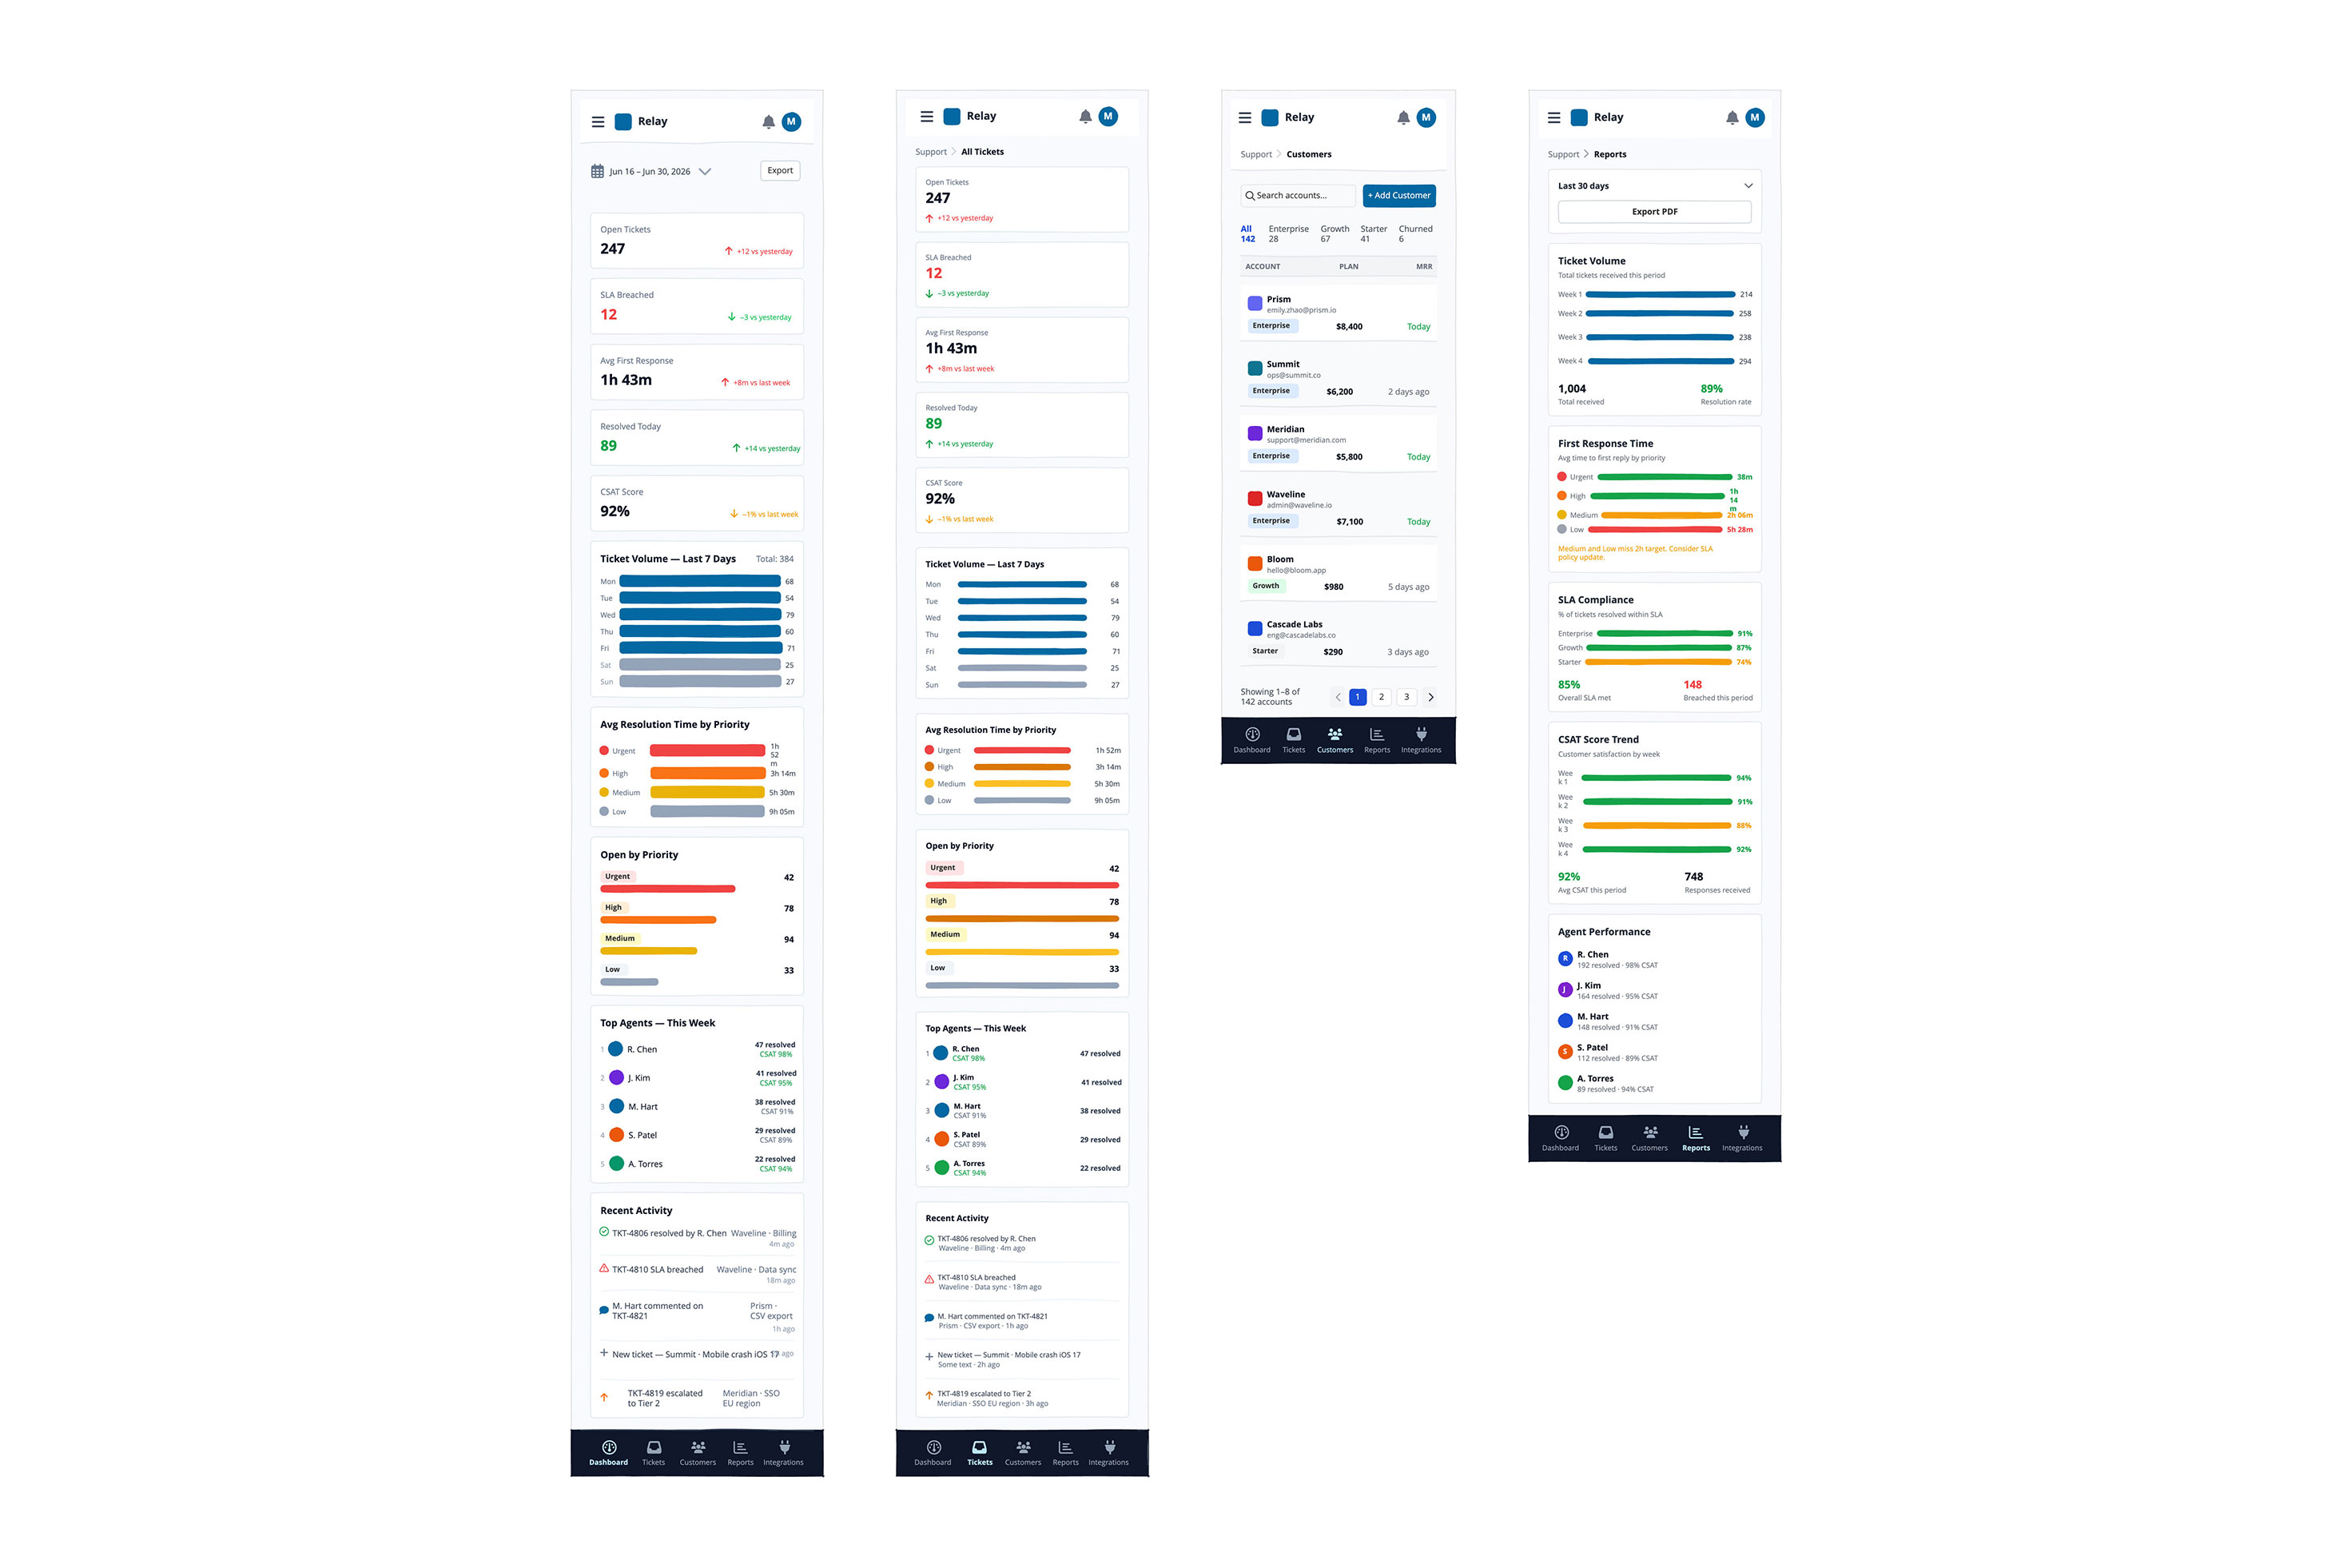
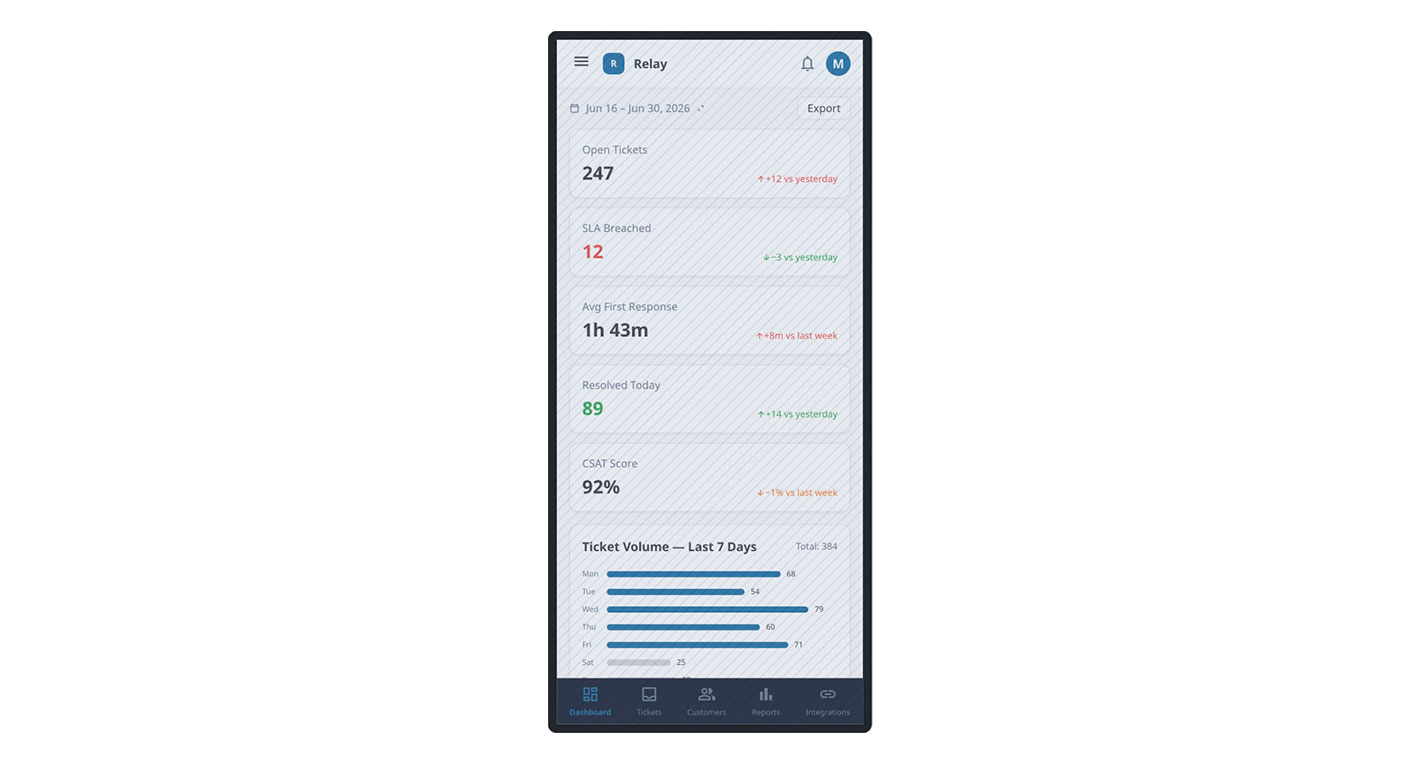
A mobile layout is also included to show how the dense desktop interface adapts to smaller screens.
Prototype
The desktop prototype connects the main navigation across all five views, allowing you to test how an agent would move between monitoring the queue, reading a ticket, and pulling a report.
The mobile prototype demonstrates how the same data hierarchy collapses into a card-based layout on a phone.
Recreate this in Balsamiq AI
Paste this prompt into Balsamiq AI to generate a similar flow, then edit any line to make it yours.
Swap the brand name, change the colors, add or remove steps and fields.
Build a suite of five wireframe boards for Relay, a fictional internal support operations tool used by customer-facing teams. The product is functional and data-dense — this is not a consumer product. Think: internal tooling, not marketing site. The aesthetic should feel like something a support lead actually uses all day: tight information density, clear status signals, no decorative flourishes.

Use 1440px board width throughout. The global background is #F8FAFC. Every board shares the same 220px dark sidebar (#1E293B) on the left. The sidebar contains: a small Relay logo lockup at top (rounded rectangle in #0369A1 + bold white "Relay" text), a divider, then two nav sections — WORKSPACE (Dashboard, Tickets, Customers, Reports, Integrations) and QUEUES (Tier 1 Support with a live red count badge, Billing, Enterprise with an amber count, Bug Reports). A flexGrow spacer pushes a user avatar + name + role + gear icon to the bottom. On each board, highlight the active nav item with a #334155 rectangle behind it and white text.

The top bar on every board is white with a bottom border (#E2E8F0), 40px tall. It shows a breadcrumb on the left (Support › [Page Name]) and page-specific controls on the right (date pickers, export buttons, search fields, etc.).

Board 1 — Tickets (Support Operations)

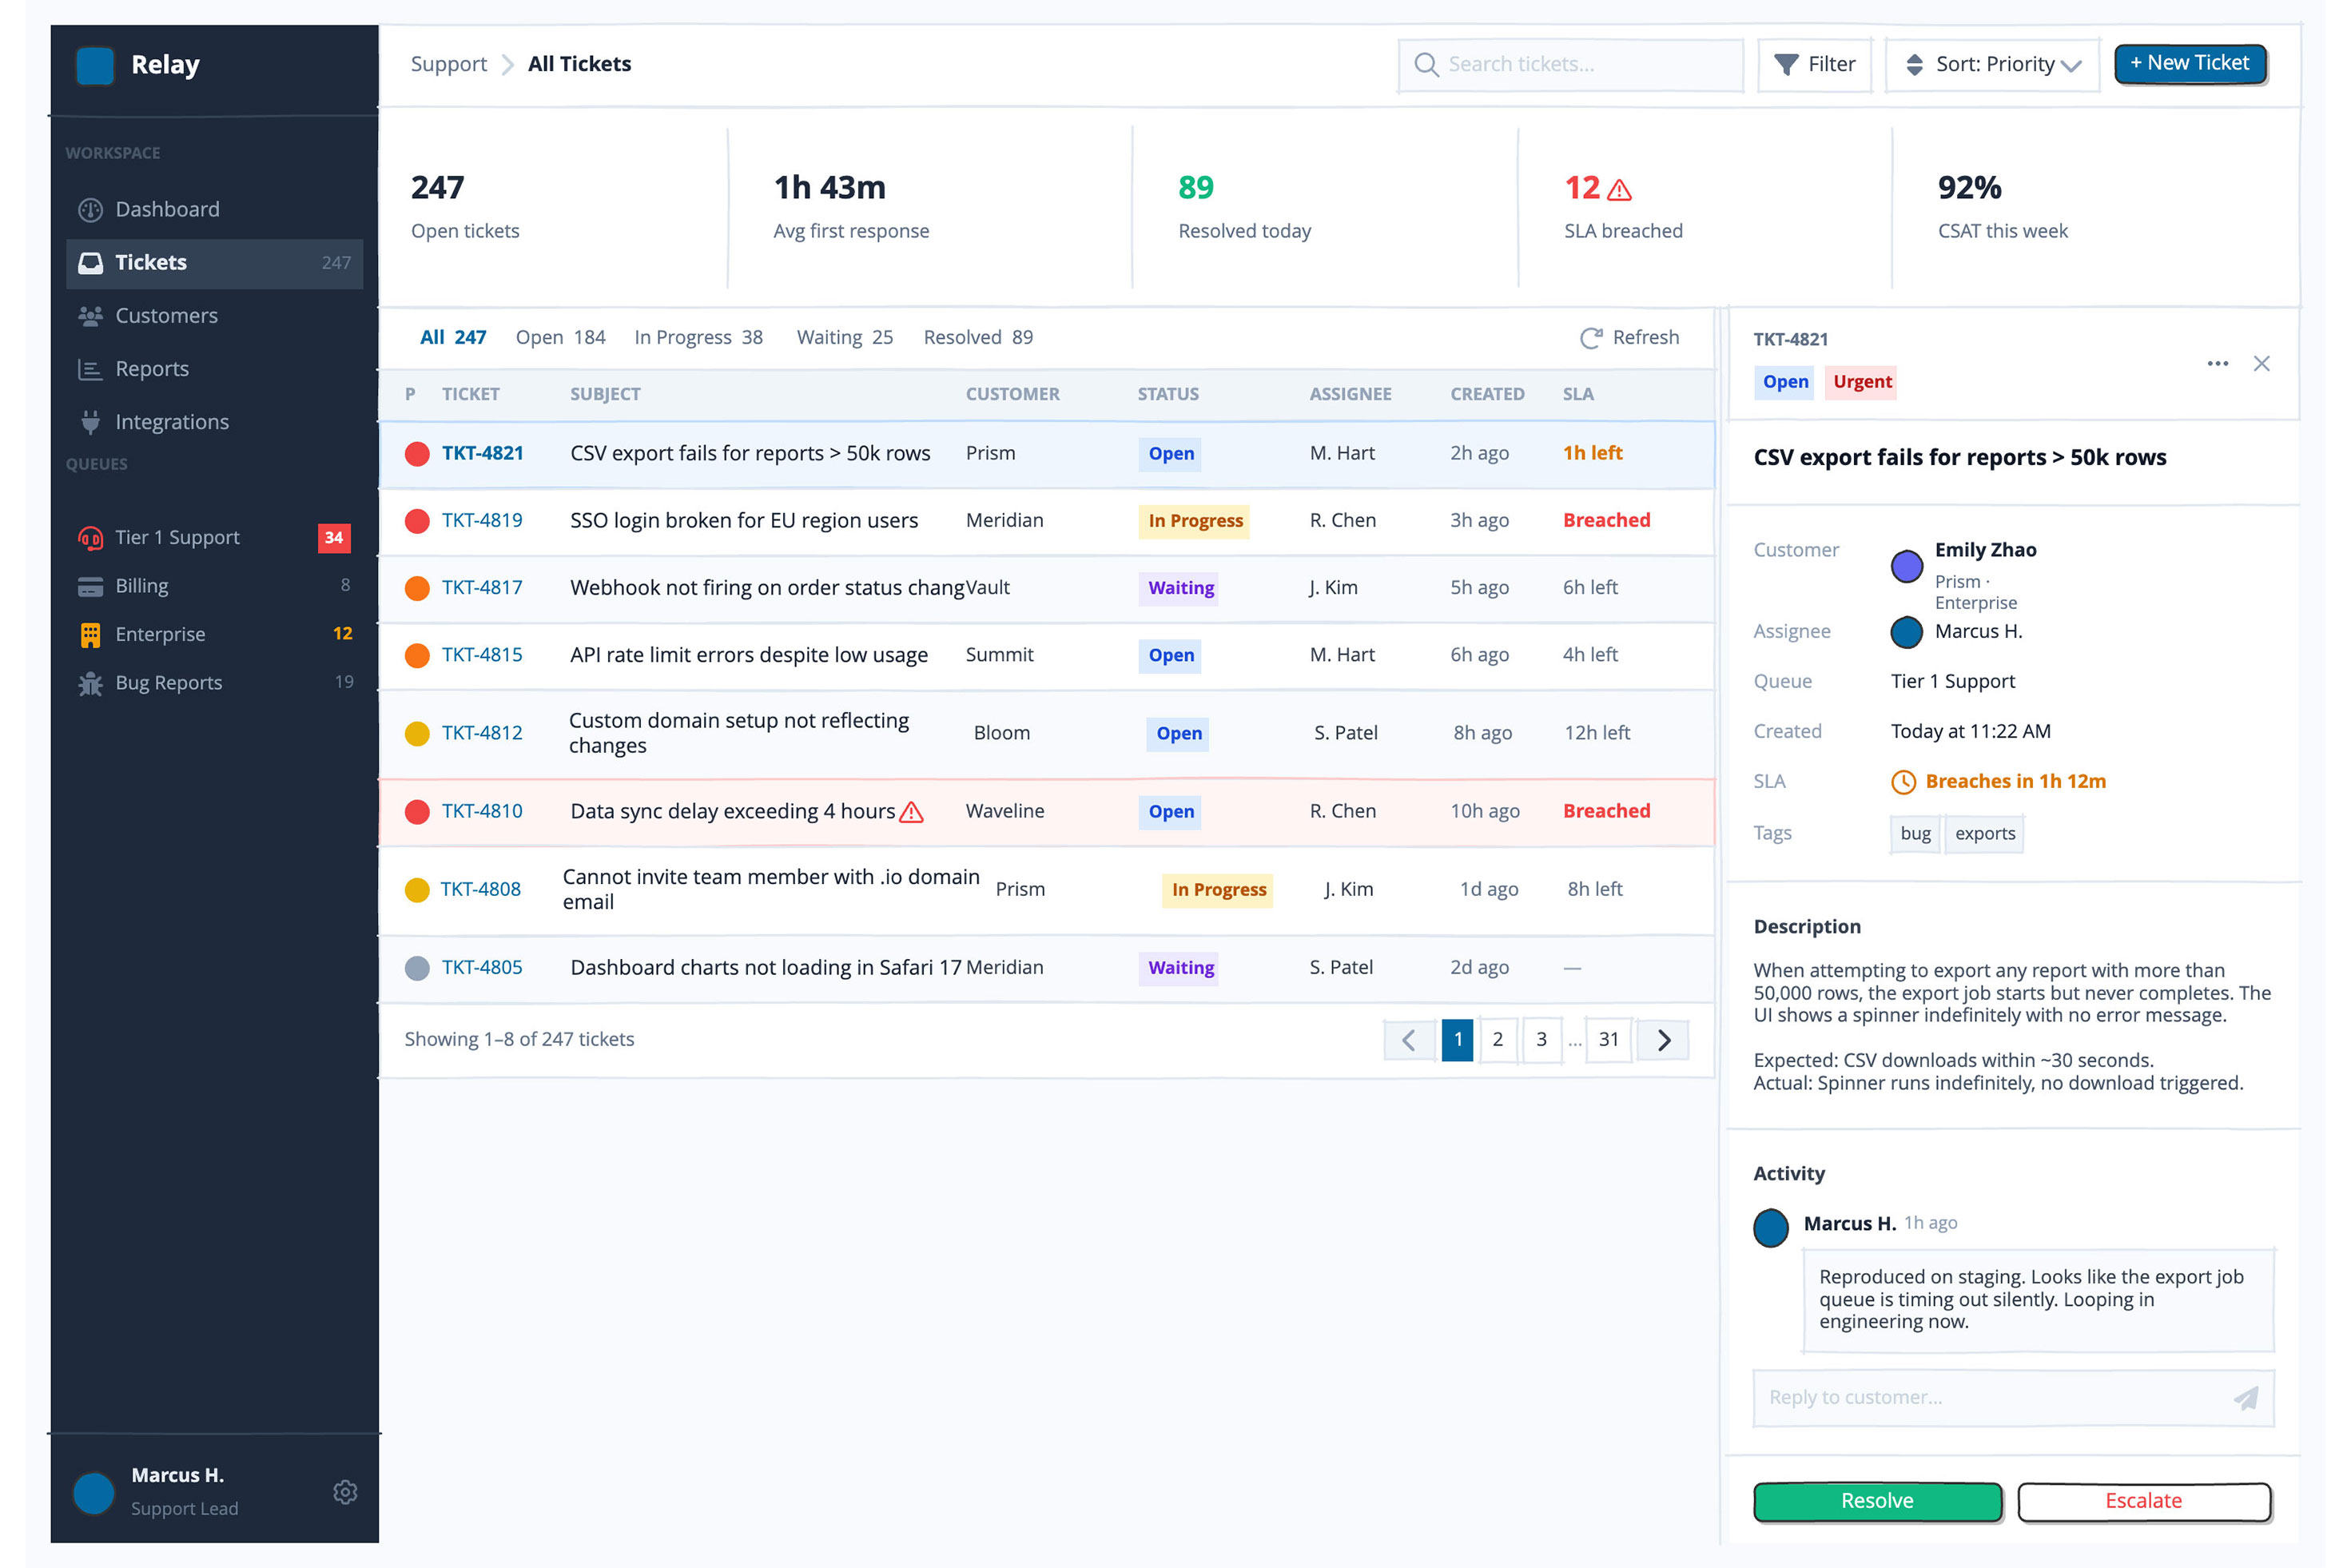
This is the main workhorse screen. The content area splits into two columns: a ticket list panel (flexGrow) and a detail panel (380px fixed, white, left border #E2E8F0).

Above the ticket list, show a KPI strip — five stat tiles in a row (each flexGrow), separated by vertical dividers: Open (247), SLA Breached (12, in red #EF4444), Avg Response (1h 43m), Resolved Today (89), CSAT (92%). Each tile has a small label in #64748B and a bold 20px number.

Below the KPI strip, render a filter/sort bar with a search field, status filter, priority filter, and assignee filter — all in a row, muted styling.

Then the ticket table: a header row with columns PRIORITY · TICKET · SUBJECT · CUSTOMER · ASSIGNEE · STATUS · CREATED, followed by 8 ticket rows. Use fa-circle at size 16 for priority dots (red = critical, orange = high, yellow = medium, gray = low). Status badges are small colored rectangles: Open (#DBEAFE bg / #1D4ED8 text), In Progress (#FEF3C7 / #B45309), Waiting on Customer (#EDE9FE / #6D28D9). Highlight the selected row (TKT-4821) with #EFF6FF background and a #BFDBFE left border. Show one SLA-breached row (TKT-4810) with #FFF5F5 background and #FECACA border. Agents: M. Hart, R. Chen, J. Kim, S. Patel. Customers: Prism, Meridian, Vault, Summit, Bloom, Waveline (all fictional).

The right detail panel shows the selected ticket (TKT-4821): subject, metadata grid (Status / Priority / Assignee / Customer / Created / SLA Due), a description paragraph, an activity feed (3–4 timestamped entries with agent initials), and two action buttons at the bottom — a solid blue "Resolve" and an outlined "Escalate".

Board 2 — Dashboard (Overview)

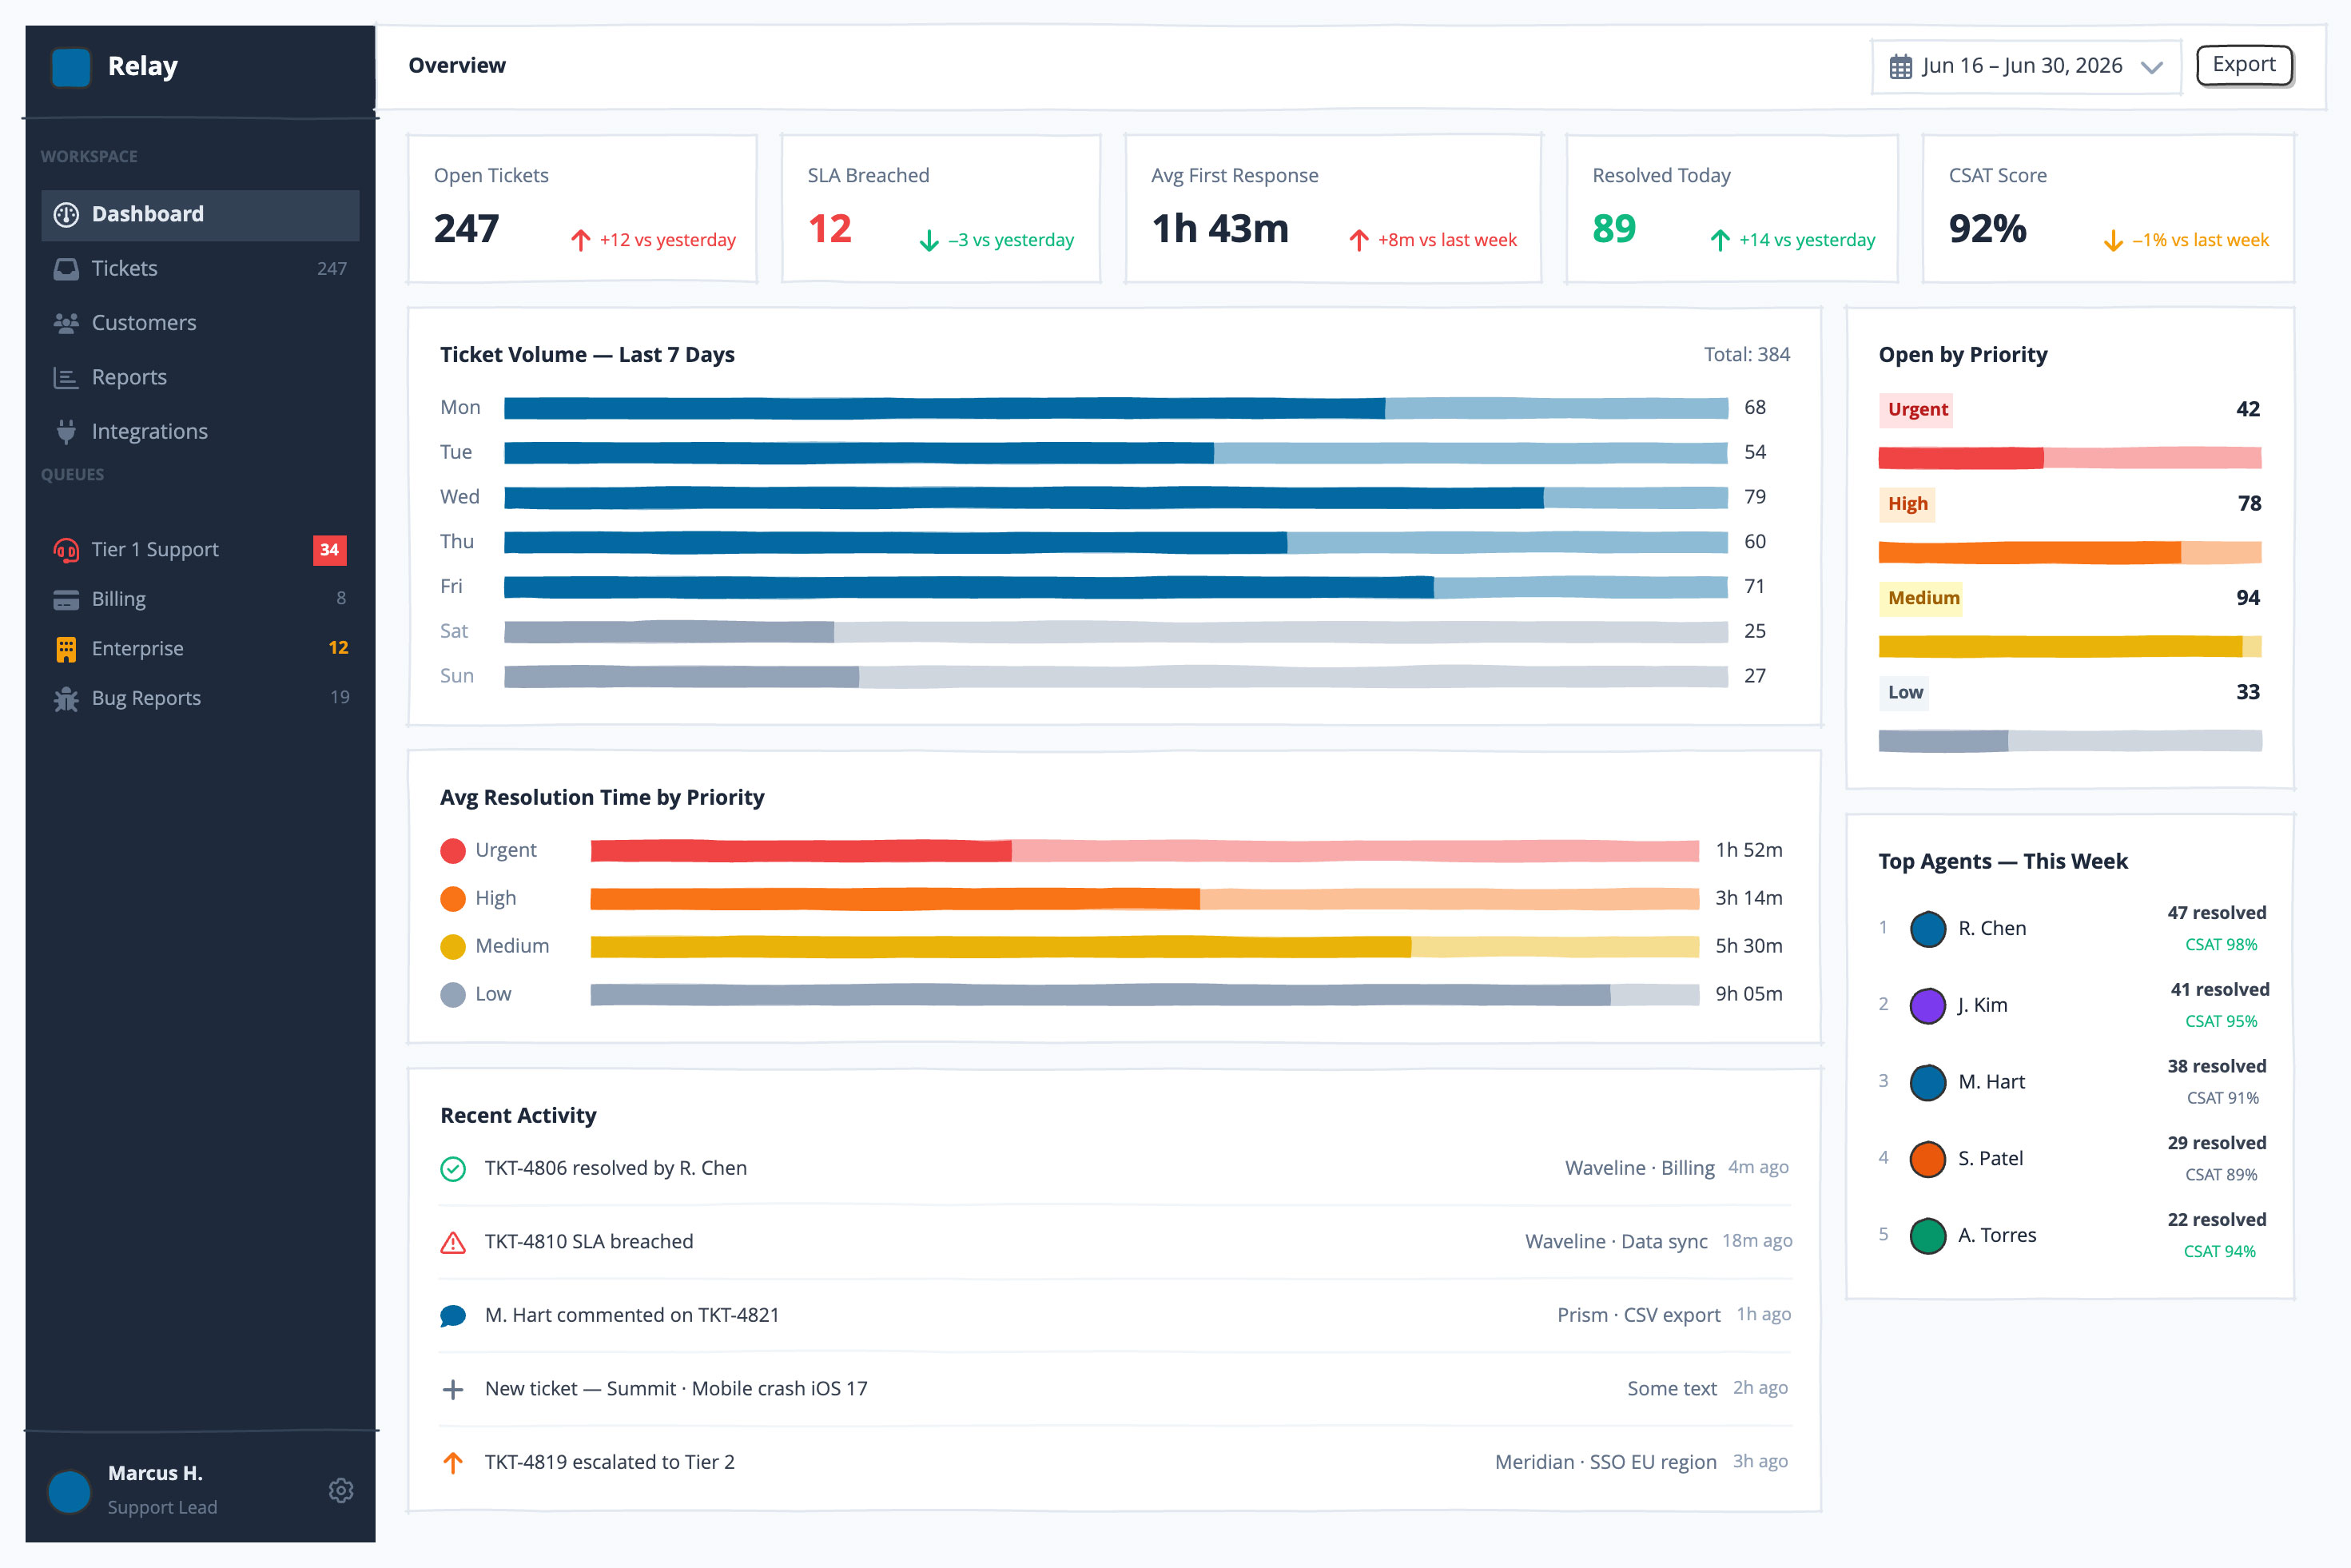
The active sidebar item is Dashboard. The top bar shows "Overview" on the left and a date range picker + Export button on the right.

Below the top bar, render five KPI stat cards in a row (each flexGrow, white, border #E2E8F0). Each card shows: a small label, a bold 26px number, and a delta indicator (arrow icon + percentage text, green for positive, red for negative, amber for flat). Cards: Open Tickets (247, −4%), SLA Breached (12, +2 red), Avg First Response (1h 43m, −12% green), Resolved Today (89, +7% green), CSAT (92%, +1% green).

Below the KPIs, split into two columns: a wider left panel and a 280px right sidebar.

Left panel contains three stacked sections, each in a white card:

Ticket Volume – Last 7 Days: seven horizontal progress-bar controls (style "thin") labeled Mon–Sun, blue (#0369A1) for weekdays, slate (#94A3B8) for weekend, with a ticket count label on the right of each bar.
Avg Resolution Time by Priority: four progress bars colored by priority (red/orange/amber/gray), labeled Critical / High / Medium / Low, with hours on the right.
Recent Activity: a feed of 5 timestamped items (agent resolved a ticket, SLA breached, new ticket from Waveline, etc.) with small agent initials circles.

Right sidebar contains two white cards:

Open by Priority: four progress bars + counts for Critical (18), High (64), Medium (109), Low (56).
Top Agents – This Week: five rows, each with agent initials circle, name, resolved count, and CSAT percentage. Agents: R. Chen, J. Kim, M. Hart, S. Patel, A. Torres.

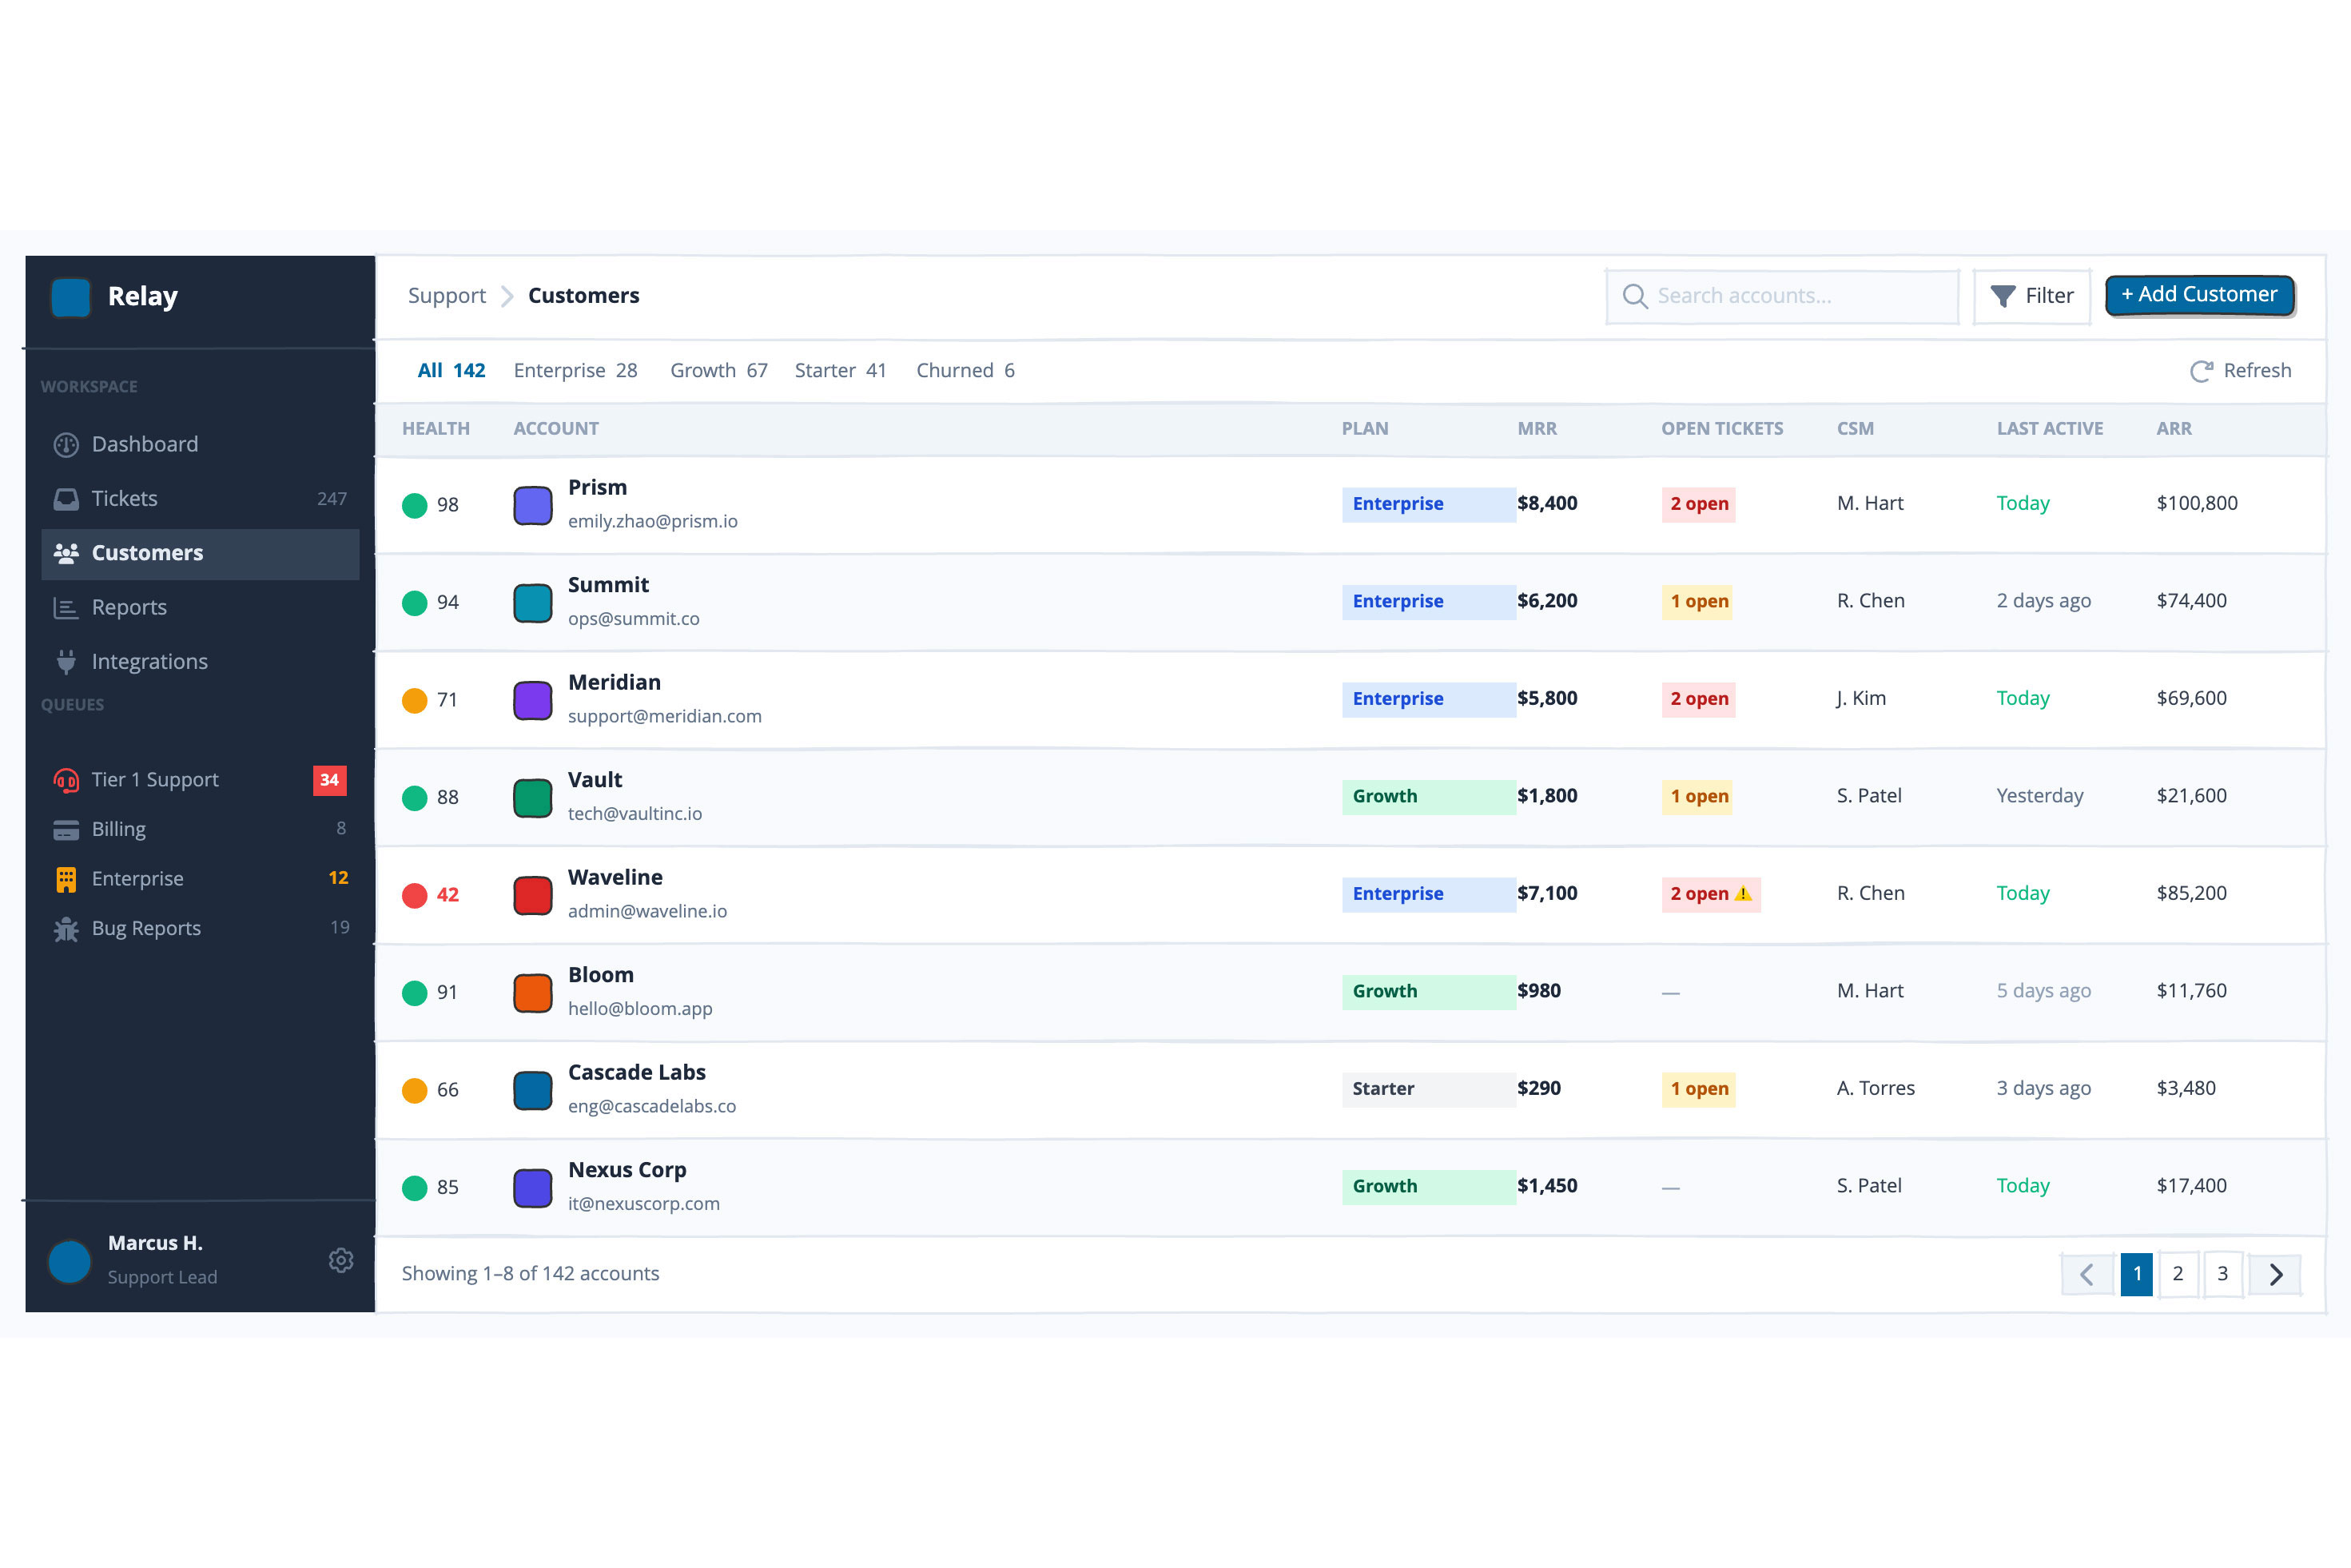
Board 3 — Customers

The active sidebar item is Customers. The top bar right side has a search field + "Export" button.

Below the top bar, show a tab strip: All (142) · Enterprise (28) · Growth (67) · Starter (41) · Churned (6). The "All" tab is active with a blue underline.

Then a full-width table (no detail panel on this page) with column headers: HEALTH · ACCOUNT · PLAN · MRR · OPEN TICKETS · CSM · LAST ACTIVE · ARR.

Show 8 customer rows:

Prism — health 98 (green dot) — Enterprise — $8,400 MRR — 2 open — R. Chen — 2 days ago — $100,800
Summit — 94 green — Enterprise — $6,200 — 1 open — J. Kim — today — $74,400
Meridian — 71 amber — Enterprise — $5,800 — 2 open — M. Hart — 5 days ago — $69,600
Vault — 88 green — Growth — $1,800 — 1 open — S. Patel — 1 day ago — $21,600
Waveline — 42 red — Enterprise — $7,100 — 2 open ⚠️ — R. Chen — 12 days ago — $85,200
Bloom — 91 green — Growth — $980 — — — J. Kim — 3 days ago — $11,760
Cascade Labs — 66 amber — Starter — $290 — 1 open — A. Torres — 8 days ago — $3,480
Nexus Corp — 85 green — Growth — $1,450 — — — S. Patel — 2 days ago — $17,400

Health: fa-circle dot + numeric score. Plan badges: Enterprise = #DBEAFE/#1D4ED8, Growth = #D1FAE5/#065F46, Starter = #F3F4F6/#374151. Open tickets: red badge for 2+, amber for 1, dash for none.

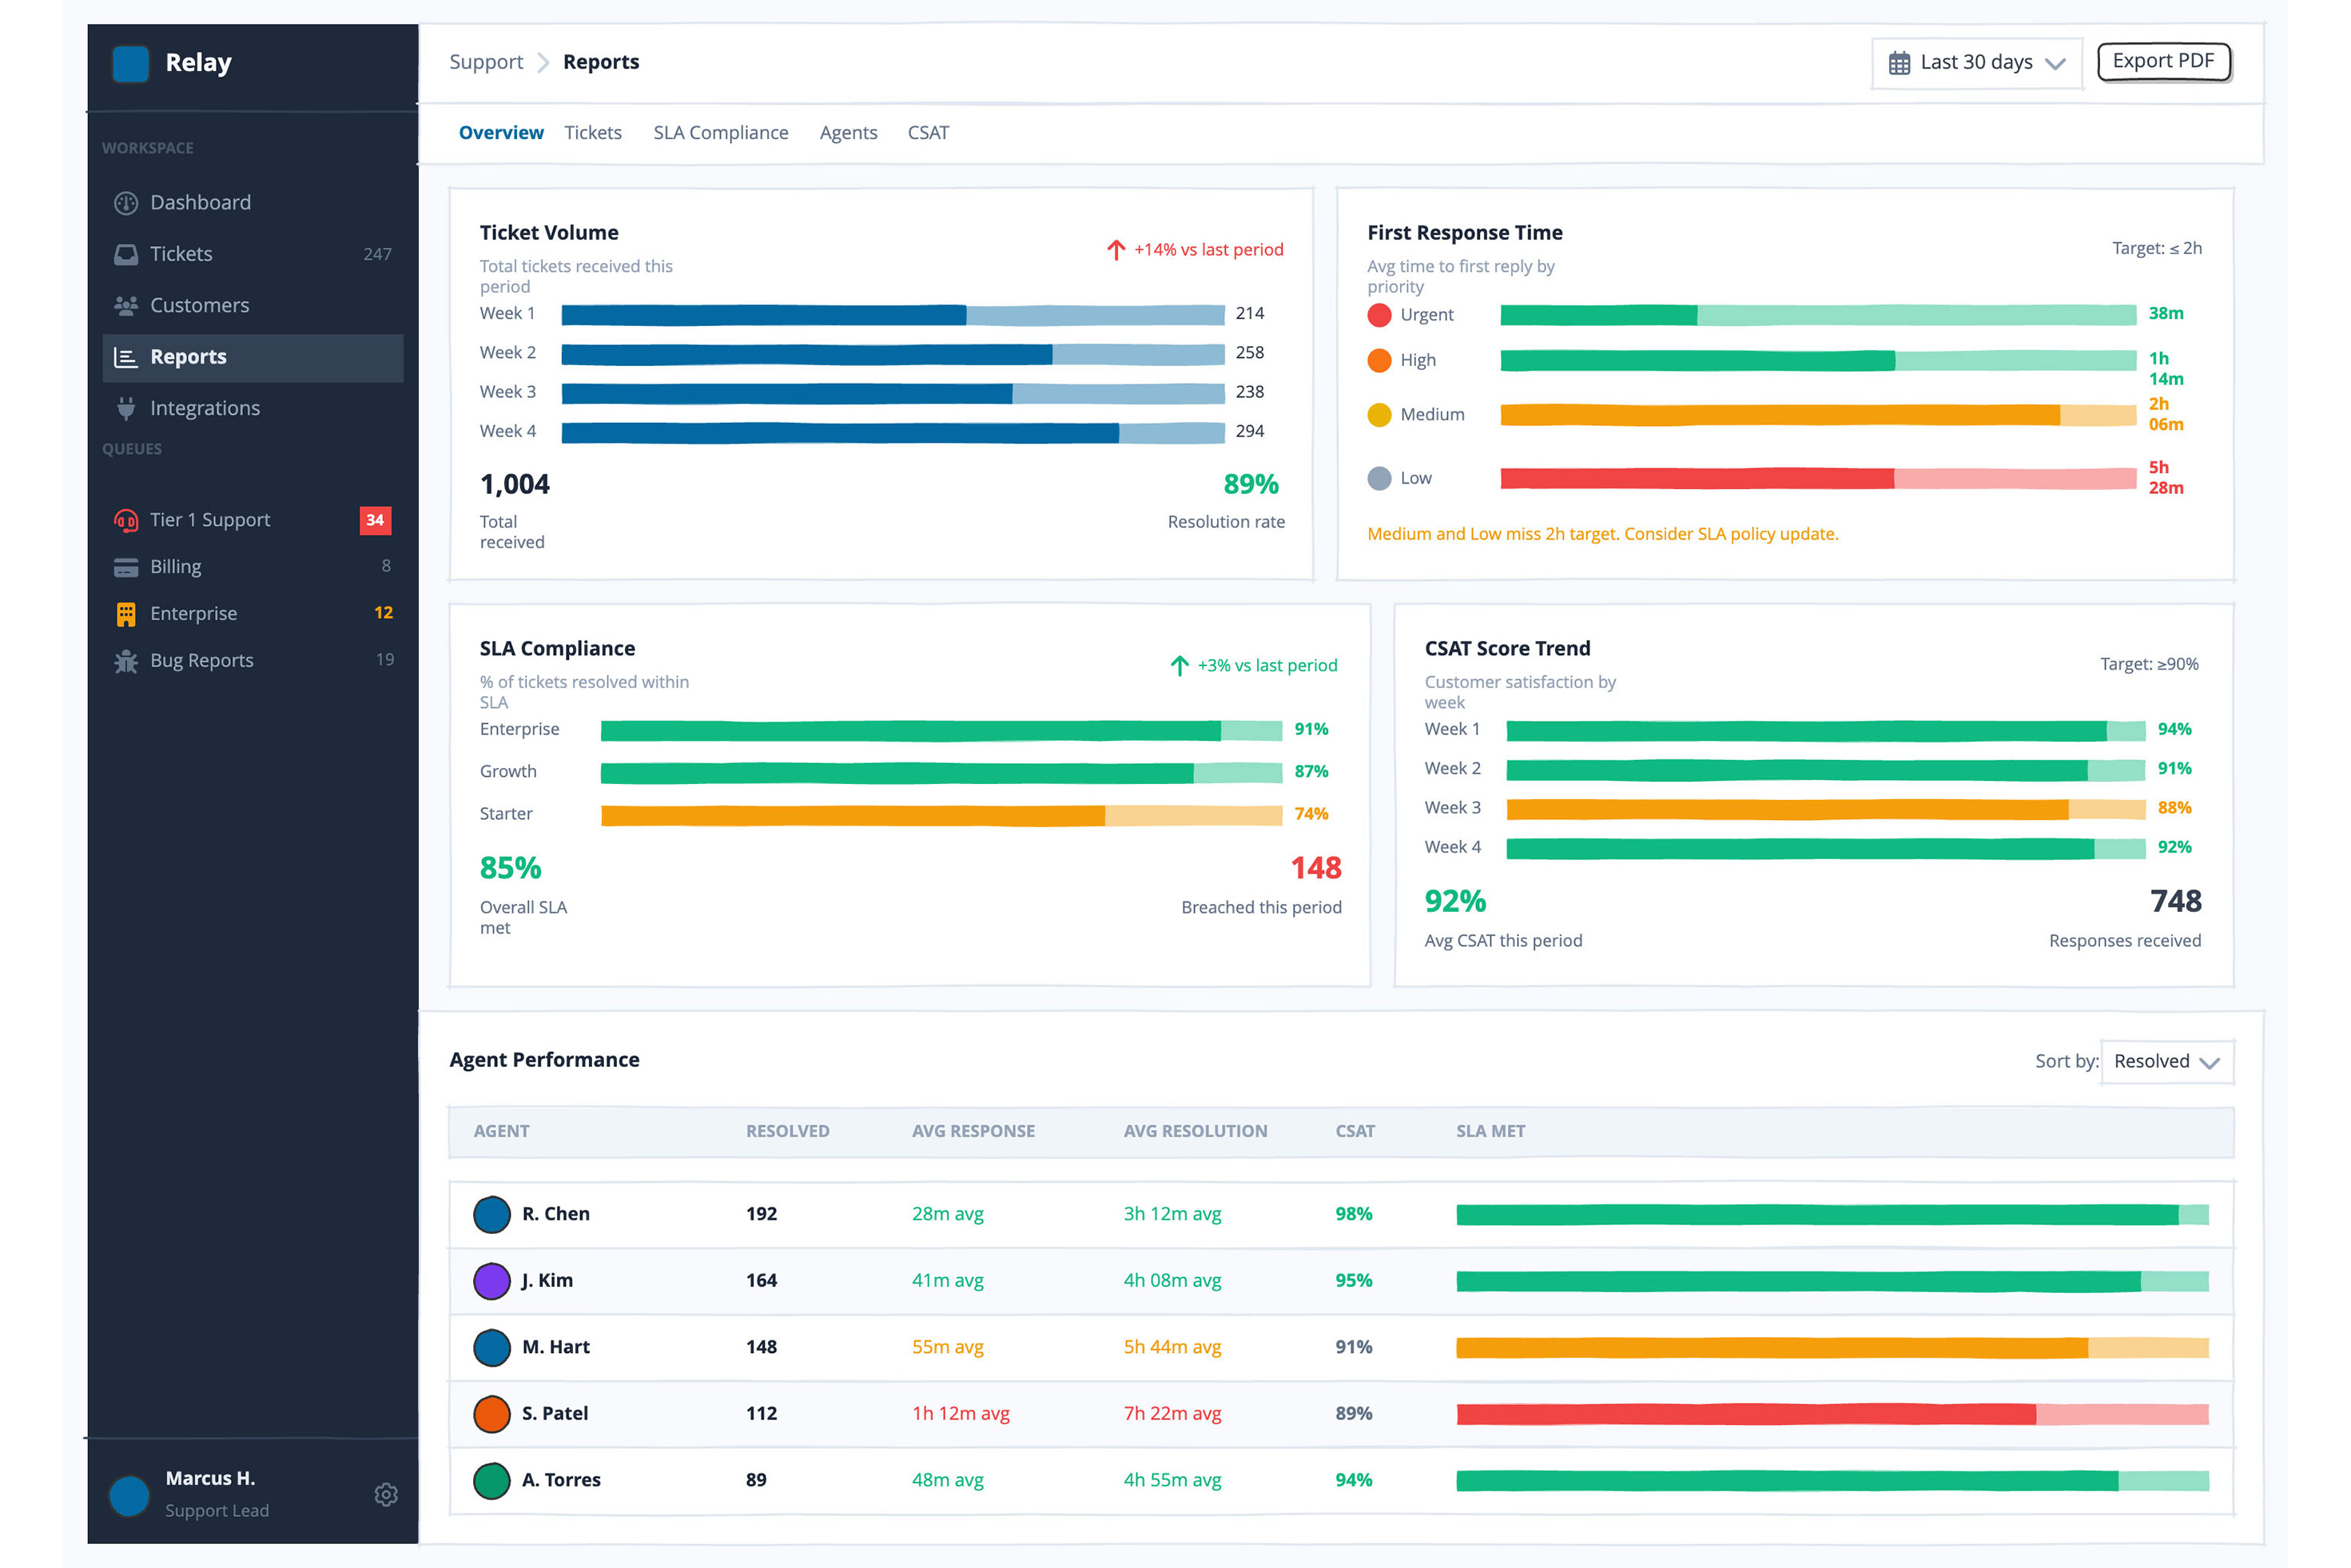
Board 4 — Reports

The active sidebar item is Reports. The top bar right side has a date range picker + "Export PDF" button.

Below the top bar, a tab strip: Overview · Tickets · SLA Compliance · Agents · CSAT. Overview is active.

Then two rows of two chart cards each, all white with #E2E8F0 borders. Use horizontal progress bars (style: "thin") to simulate chart bars throughout — this is a wireframe, not a real charting tool.

Row 1:

Ticket Volume – Last 4 Weeks: four bars (Week 1–4) in blue #0369A1, values roughly 210/247/198/263, with count labels.
First Response Time by Priority: four bars colored by target status — Critical 38m (green, on target), High 1h 12m (amber, borderline), Medium 3h 45m (red, over target), Low 8h 20m (green, within SLA).

Row 2:

SLA Compliance by Plan: three bars — Enterprise 91% (green), Growth 87% (amber), Starter 74% (red).
CSAT Score Trend: four bars (Week 1–4) at 89%/91%/88%/92%, colored green/amber/green/green.

Below the chart rows, an Agent Performance table with columns: AGENT · RESOLVED · AVG RESPONSE · AVG RESOLUTION · CSAT · SLA MET (progress bar column). Five agent rows: R. Chen, J. Kim, M. Hart, S. Patel, A. Torres. SLA Met column uses a thin progress bar — green for ≥90%, amber for 80–89%, red below 80%.

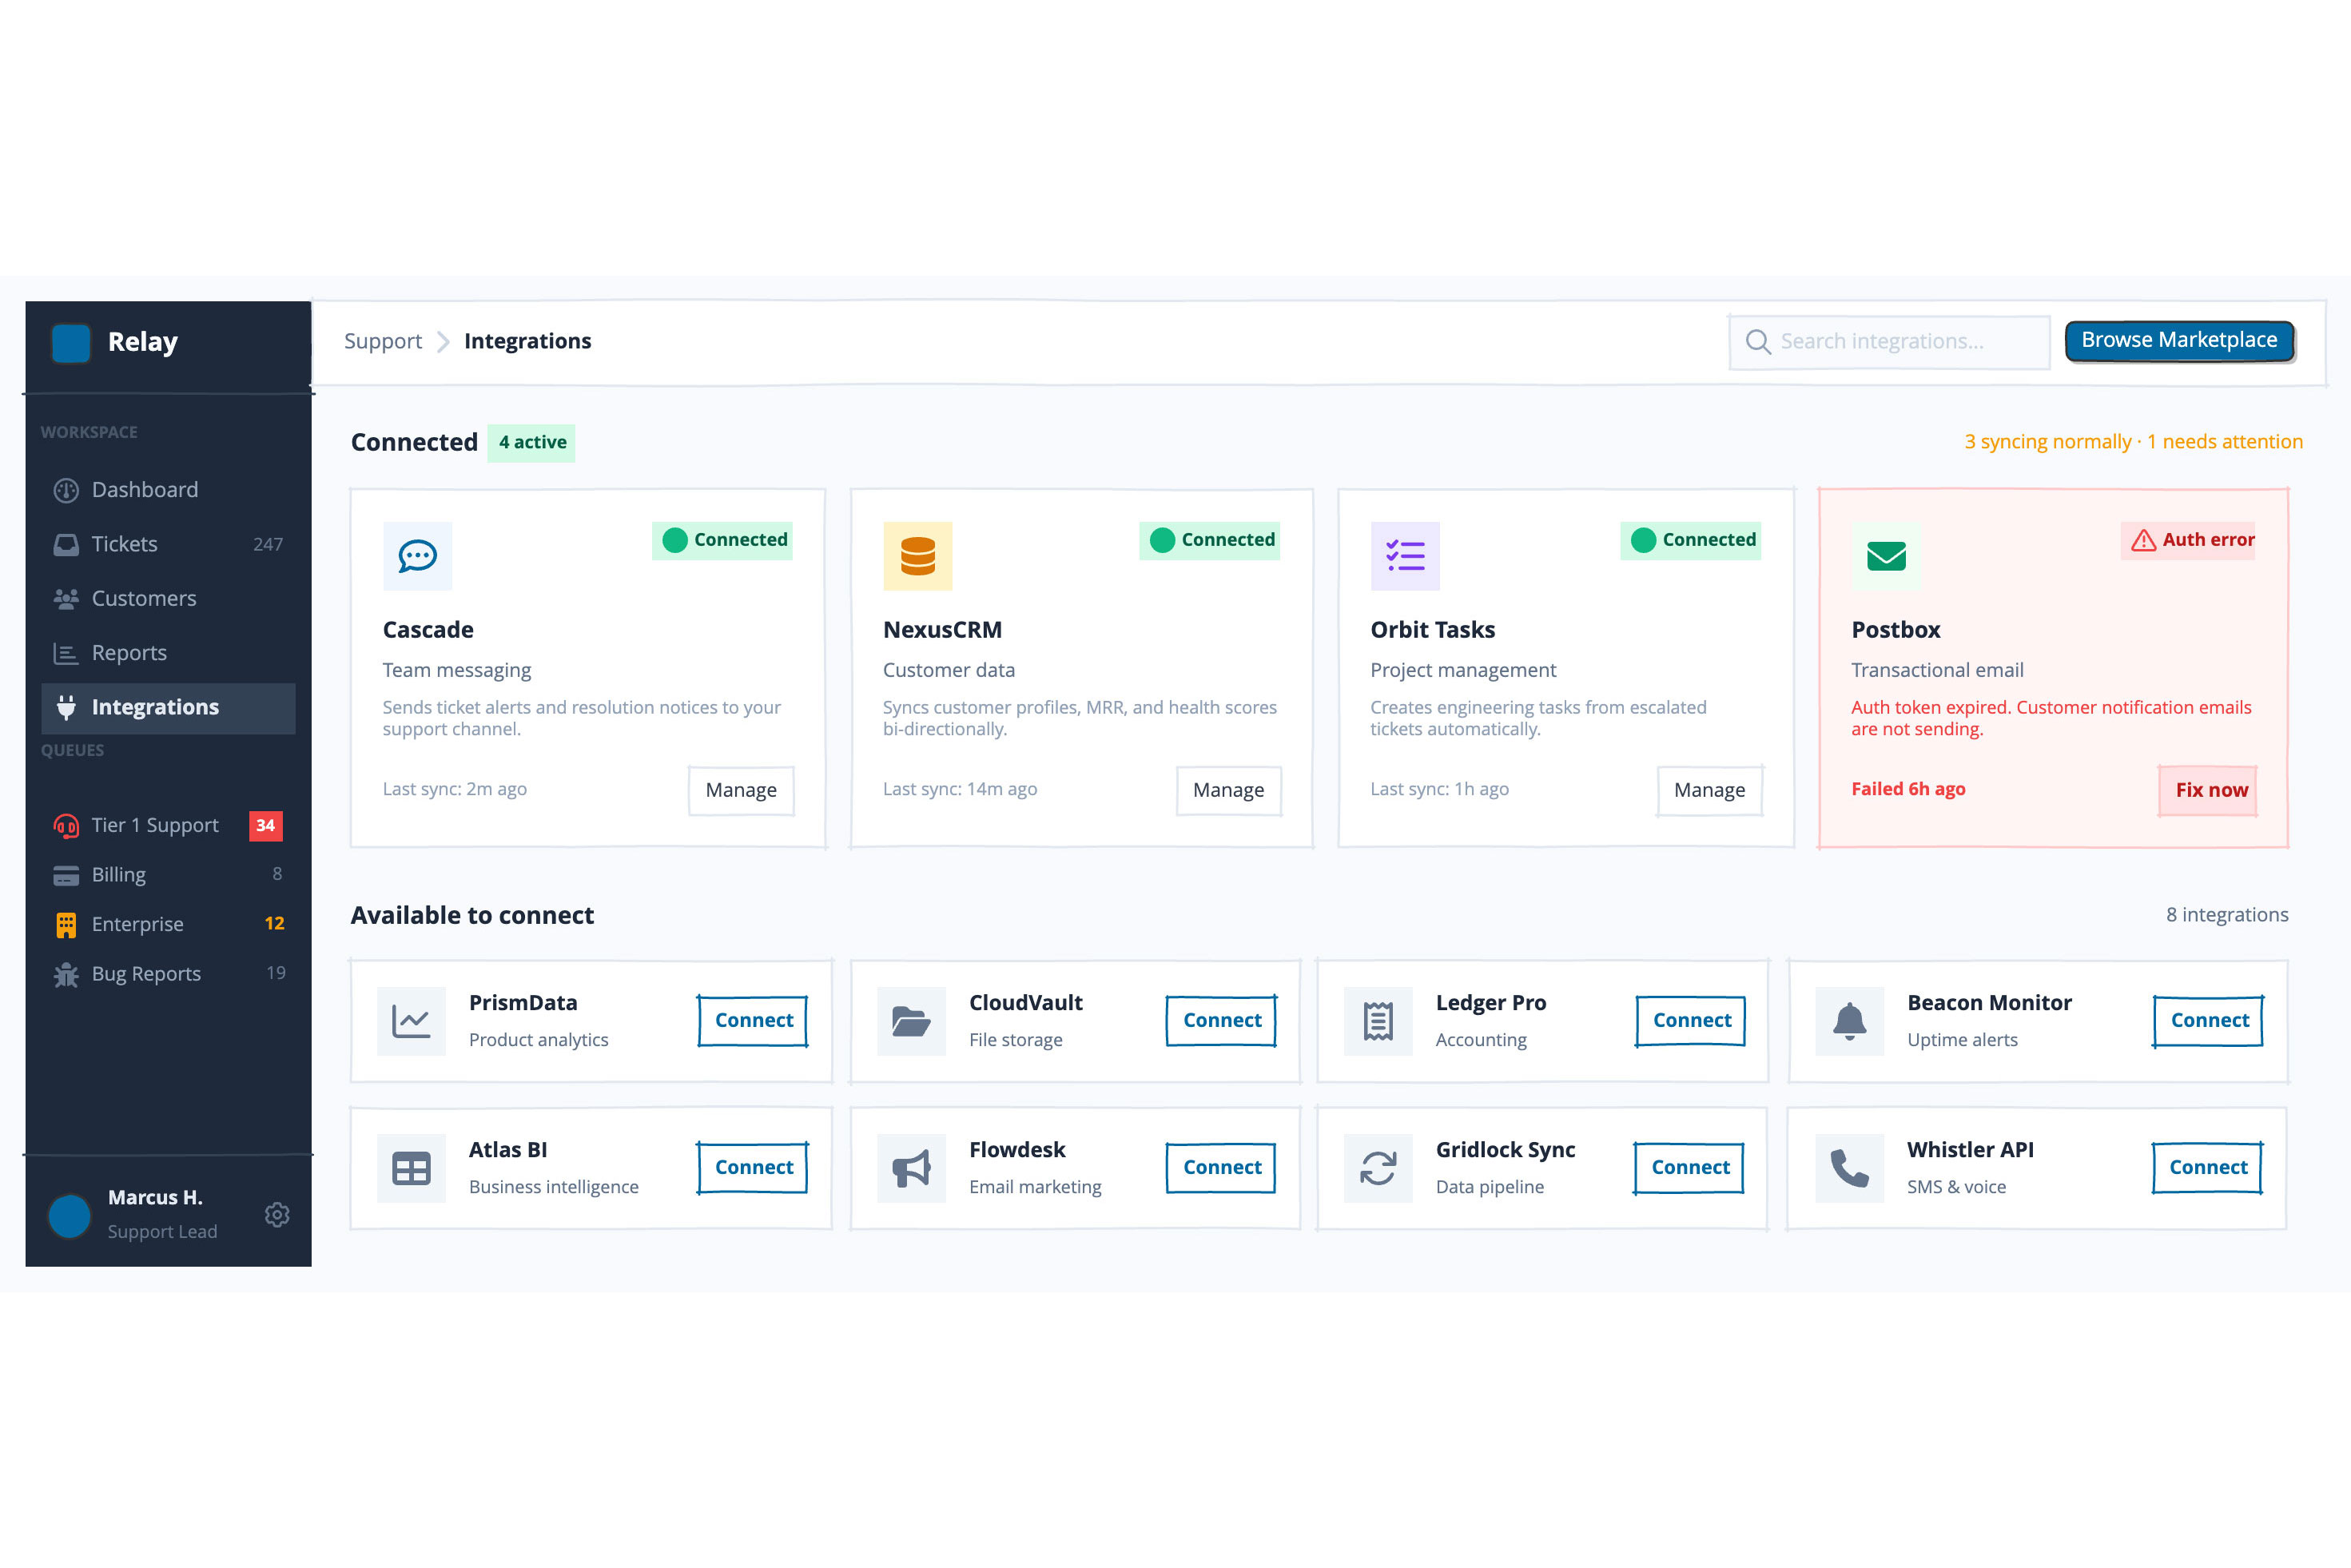
Board 5 — Integrations

The active sidebar item is Integrations (use fa-plug icon). The top bar right side has a search field + "Browse Marketplace" button.

The content area has two sections, stacked vertically with 32px gap.

Connected (4 active) — a header row showing the section title with a green #D1FAE5 badge ("4 active") and a right-aligned note "3 syncing normally · 1 needs attention" in amber. Below it, four cards in a row (each flexGrow, white, #E2E8F0 border):

Cascade (team messaging, fa-comment-dots, #EFF6FF icon bg, #0369A1) — green "Connected" badge — "Last sync: 2m ago" — "Manage" button.
NexusCRM (customer data, fa-database, #FEF3C7 icon bg, #D97706) — green "Connected" — "Last sync: 14m ago" — "Manage".
Orbit Tasks (project management, fa-list-check, #EDE9FE icon bg, #7C3AED) — green "Connected" — "Last sync: 1h ago" — "Manage".
Postbox (transactional email, fa-envelope, #F0FDF4 icon bg, #059669) — error state: card background #FFF5F5, border #FECACA, red "Auth error" badge with fa-triangle-exclamation, red body text "Auth token expired. Customer notification emails are not sending.", "Failed 6h ago" in red, and a #FEE2E2 "Fix now" button.

Available to connect (8) — section title + "8 integrations" count. Two rows of four cards each. Each card is a compact horizontal row: #F1F5F9 icon square (24px icon, #64748B) + name (bold 13px) + category label (12px #64748B) + flexGrow spacer + outlined "Connect" button in #0369A1.

Row 1: PrismData (product analytics, fa-chart-line) · CloudVault (file storage, fa-folder-open) · Ledger Pro (accounting, fa-receipt) · Beacon Monitor (uptime alerts, fa-bell)

Row 2: Atlas BI (business intelligence, fa-table) · Flowdesk (email marketing, fa-bullhorn) · Gridlock Sync (data pipeline, fa-arrows-rotate) · Whistler API (SMS & voice, fa-phone)

Constraints across all boards:

No real company or product names — use Prism, Meridian, Summit, Bloom, Waveline, Vault, Cascade, NexusCRM, Orbit, Postbox, etc.
All agent names should be realistic but fictional (R. Chen, J. Kim, M. Hart, S. Patel, A. Torres).
The design should feel functional and slightly dense — this is an internal tool, not a consumer product.
Icon sizes must snap to valid Balsamiq values: 16, 24, 32, 48, 64, 128.
Use layout.wrap: true (boolean) if you need wrapping flex rows — never the string "wrap".
Try editing it: change "Relay" to your product name, or swap #F8FAFC for your brand color — then regenerate.
Open Balsamiq AI